Development Tool
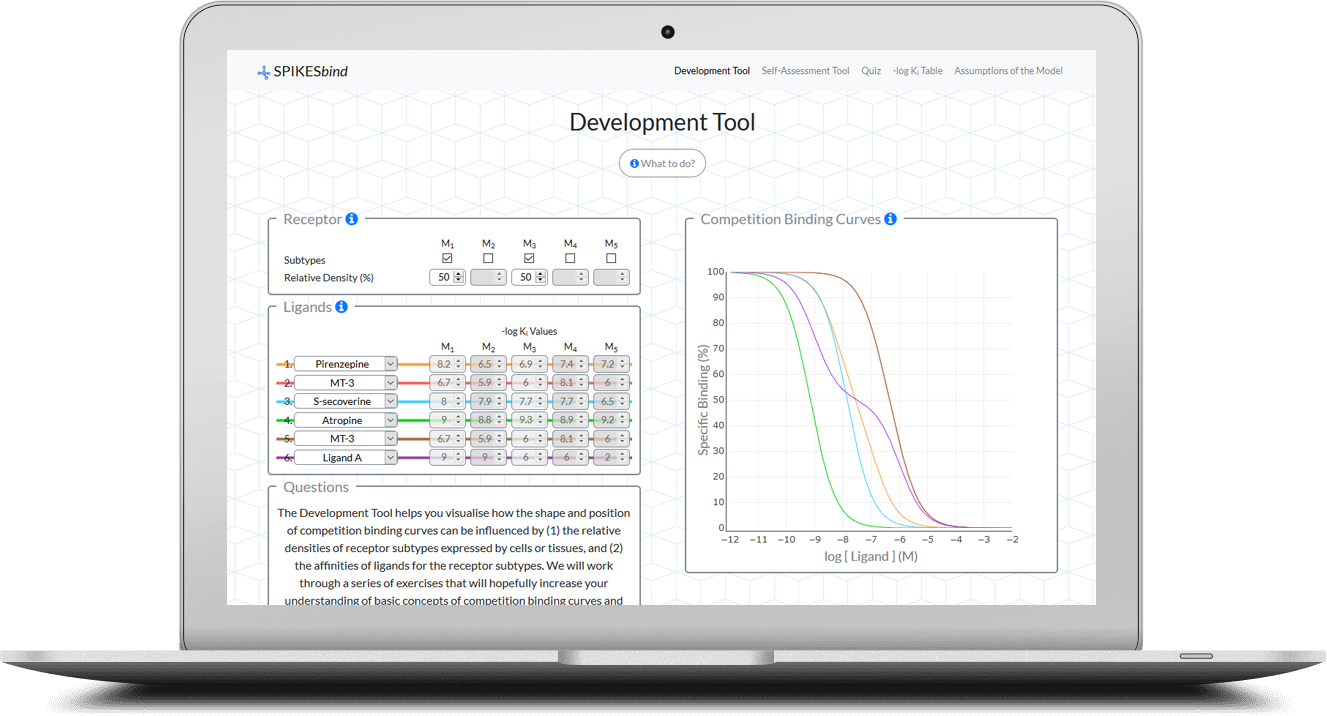
The Development Tool can be used to visualise how the shape and position of competition binding curves can be influenced by:
1. the relative densities of receptor subtypes expressed by cells or tissues, and
2. the affinities of ligands for the receptor subtypes.
The following instructions demonstrate how these changes in the shape and position of competition binding curves can be visualised using the Development Tool.
Firstly, you select which receptor subtypes are present in the cell or tissue of interest.
Within the Receptor up to three receptor subtype combinations by clicking on the appropriate buttons below the name of the subtype. Once a particular subtype has been selected, the Relative Density (%)
If only one receptor subtype is selected, then the Relative Density (%)
If two receptor subtypes are selected, then the sum of their Relative Density (%) Relative Density (%)
If three receptor subtypes are selected, then the combined value must again be 100. In this case, enter the receptor density values in order from left to right, i.e. start with the receptor subtype with the lowest number selected (e.g. M1 ) to the receptor subtype with the highest number (e.g. M5 ).
Once the first two receptor densities have been selected, the final density will automatically be calculated.
For example , if you wished to use a cell that expresses a combination of M2 , M4 and M5 receptors in the relative proportions 20:30:50, respectively, then select the M2 , M4 and M5 subtypes. In order, enter the values of 20% for M2 and 30% for M4 . M5 will automatically be assigned a 50% density.
Secondly, you select which ligands you wish to use in the competition binding studies.
Within the Ligands up to 6 ligands from a list of 8 Established Hypothetical
Established i values (e.g. Atropine).
Hypothetical SPIKESbind to increase applicability.
There are 2 types of Hypothetical Ligand A and Ligand B , which have marked (but defined) differences in affinities for receptor subtypes.
The second type of Hypothetical Ligand C and Ligand D , and these are ligands where you can assign (and change) a –log Ki value (affinity) for each receptor subtype. The assigned –log Ki values must be between 3 and 10 and may be changed by either using the arrows (increments of 0.1), or by typing in the desired value (3-10).
The ligands included in the drop down menu and their corresponding -log Ki values can be viewed in the '-log Ki Table ' tab.
Lastly, once receptor subtypes and ligands have been selected, a plot of the specific binding % is displayed in real time within the Competition Binding Curves window.
By inserting the appropriate -log Ki values into the one-, two- or three-site binding models, accompanied by the selected subtype receptors, SPIKESbind will calculate the % specific binding values over the ligand range 10-12 - 10-2 M and will generate the Competition Binding Curves
A feature of SPIKESbind is that any changes to the receptor subtype or the ligands selected will cause the Competition Binding Curves For example , you can directly observe (in real time) changes in the shape and position of Competition Binding Curves
Self-Assessment Tool
In the Self-Assessment Tool, you choose up to 6 ligands (from the list of 12 Established Hypothetical Competition Binding Curves for these selected ligands are then displayed in the Competition Binding Curves window based on a receptor profile (the receptor subtypes and their relative densities) that has been randomly generated by SPIKESbind .
The task for you is to analyse the competition binding curves using the SPIKES approach,
and deduce which receptor subtypes are present and their relative densities.
The actual receptor profile can be revealed at any time by clicking the Reveal Subtype button.
Firstly, you select which ligands you wish to use in the competition binding studies.
From within the Ligands window, select up to 6 Ligands from a list of 8 Established Hypothetical Established Hypothetical SPIKESbind to increase applicability.
There are 2 types of Hypothetical Ligand A and Ligand B , which have marked (but defined) differences in affinities for receptor subtypes.
The second type of Hypothetical Ligand C and Ligand D , and these are ligands where you can assign (and change) a –log Ki value (affinity) for each receptor subtype. The assigned –log Ki values must be between 3 and 10 and may be changed by either using the arrows (increments of 0.1), or by typing in the desired value (3-10).
The ligands included in the drop down menu and their corresponding -log Ki values can be viewed in the '-log Ki Table ' tab.
Secondly, the competition binding curves will appear for the selected ligands, showing the specific binding % over the ligand range 10-12 - 10-2 M.
The shape and position of the competition binding curves generated depends on which specific receptor subtypes are present and their relative densities (e.g. 30% M1 and 70% M2 ).
The receptor profile is randomly selected by SPIKESbind from a defined bank of approximately 75 options.
The bank of 75 options is based on the premise (1) that there are 10 possible combinations involving two receptor subtypes
(M1 /M2 , M1 /M3 , M1 /M4 , M1 /M5 , M2 /M3 , M2 /M4 , M2 /M5 , M3 /M4 , M3 /M5 and M4 /M5 ),
and (2) that for each receptor combination there are 7 possible receptor density combinations (20/80, 30/70, 40/60/ 50/50, 60/40, 70/30 and 80/20) – giving a total of 70 options for two-receptor subtype combinations. This 70 options, together with another 5 options for pure receptor subtypes (100%), gives a grand total of 75 options from with SPIKESbind can choose to present.
All 90%/10% and small incremental combinations have been omitted for your benefit as they cannot be reliably interpreted by eye.
Using the SPIKES approach to deduce which receptor subtypes are present and their relative densities. Your answer should be one of the 75 options.
Lastly, after you have worked out your answer, you may reveal the solution to validate your work.
You can reveal which receptor subtype population exists and their relative densities by clicking the Reveal Subtype button, and the answer will appear.
After viewing the solution, the ligands may be modified in the ligand table to view other competition binding curves, including the custom -log Ki values for ligands C and D, and the graph will dynamically update.
To generate a new question in the Self-Assessment Tool, click the Reset button and a new receptor subtype combination option will be randomly generated by SPIKESbind .
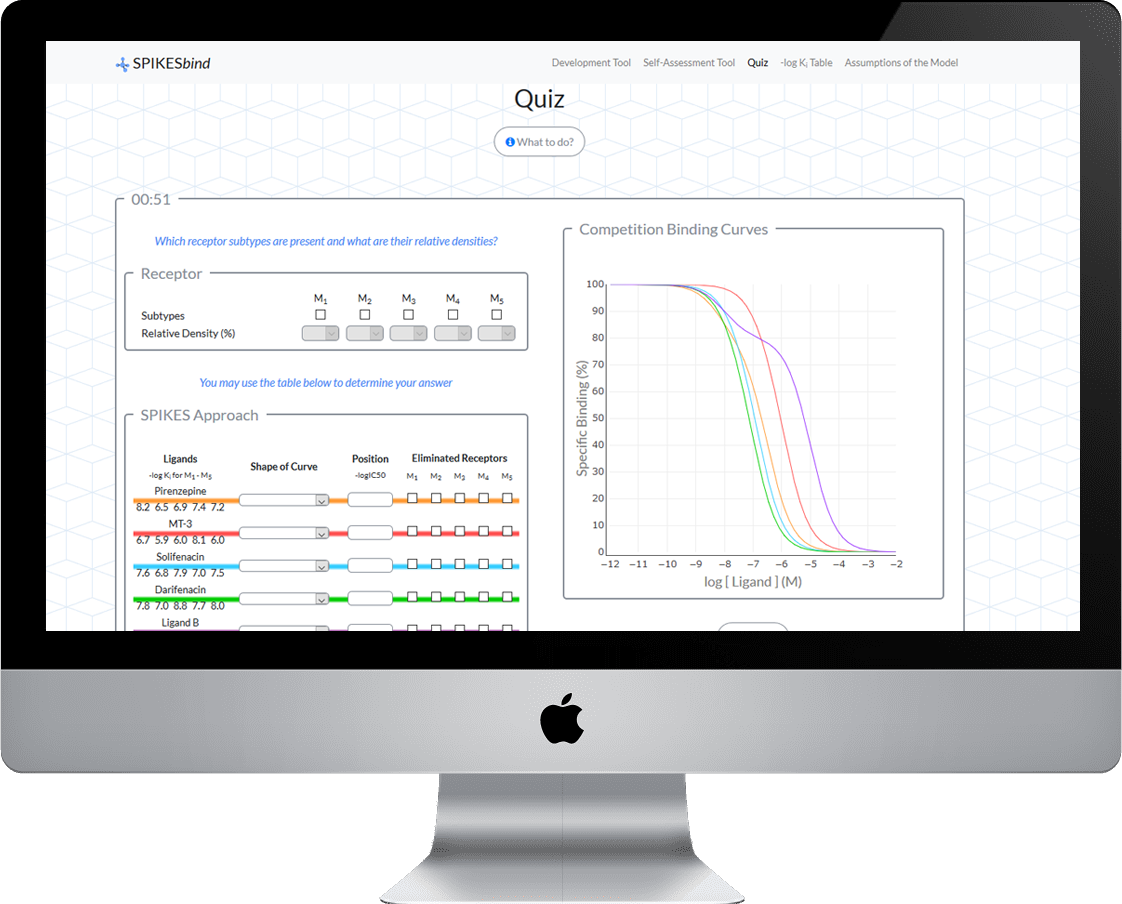
Quiz
The Quiz Tool works off the same premise as the Self-Assessment tool, where any one question is randomly selected from a list of 75 options (i.e. up to two receptor subtypes with relative densities between 20-80%, using 10% increments).
However, the Quiz Tool is different from the Self-Assessment tool as the ligands used in the Competition Binding studies are pre-selected by SPIKESbind . In the Quiz Tool, SPIKESbind selects 5 ligands – 4 of which will be randomly selected from the list of 7 selective Established Pirenzepine, Methoctramine, Darifenacin, MT-3, S-Secoverine, Solifenacin and DAU-5884 ), and one Hypothetical ligand, either Ligand A or Ligand B . This provides the opportunity for over 500 different questions to be posed by the Quiz Tool – sufficient to gain expert proficiency in interpreting competition binding data.
Analyse the Competition Binding Curves using the SPIKES approach to solve which receptor subtypes are present, and what their densities are. Note that not all questions within the Quiz Tool can be answered by eye – for these questions you should be able to indicate which additional ligand(s) would allow the question to be answered unequivocally (and why).
Prior to commencing the quizzes, you may wish to read through the SPIKES examples to gain an insight into how to systematically approach solving competition binding data using the SPIKES approach.
Follow the instructions below to undertake the Quiz.
From the Quiz homepage, click the Start Quiz button, and the quiz will commence with the question appearing.
At the top of the page, you will notice the timer appear, counting up from 0 seconds until your answer is submitted. This allows for you to record the time spent evaluating each question, and over time you should be able to see your times improve. Once the quiz is complete you are taken to the answer review page.
The graph in question will appear on the right hand size, showing the 5 pre-selected ligands plotted with the randomised mixed receptor subtype combination.
Use this information to work out your solution (i.e. which receptor subtypes are present and their relative densities). Provided is a ‘SPIKES Approach’ table for you to help determine the answer. In this table you are able to view the list of ligands displayed in the graph, along with their corresponding -log Ki values, a drop down menu to determine the shape of the curve, a position textbox to enter information for the -logIC50 value, and checkboxes to eliminate receptor subtypes (i.e. apply the SPIKES approach).
Once you have completed your analysis, enter which receptor subtype(s) you believe to be present and their relative densities, using the checkboxes and drop down menus provided.
After you are happy with your answer, click the Submit button to head to the answer 'Review'
At the ‘Review’ Amend your Answers or to start a New Quiz .